March 2012
The What’s New at Stock Trading Warrior Newsletter brings you stock trading news, analysis and tips. In this month's newsletter you'll find information on the following:
- The Stock Trading Warrior's Guide to How to Read Stock Market Trend
- The Amazing Origins of the Stock Market
- STW Comedy Corner
- Limit Order Question
- Stock Pix - Hot or Not?
Each month beginning in January 2012, the Stock Trading Warrior Newsletter will focus on developing part of a strong,
stock trading system
to help you create or fine-tune your stock trading performance.
Let's make 2012 your best stock trading year ever!
The Stock Trading Warrior's Guide
How to Read Stock Market Direction
Since the February newsletter, I hope you've had a chance to work through Step 2. of your Stock Trading System -
Find the Best Stocks to Buy.
If so, to recap, you've done the following:
- practiced using a scanner (for technical indicators) or screener (for fundamentals) to find the best stocks that fit your strategy;
- looked at some stock performance lists for ideas;
- been able to narrow down your stock choices using higher than average volume or 52-week highs as additional filtering criteria;
- found some stocks to put in a watch list or to buy and put in your portfolio.
In Step 3. of building a Stock Trading System - How to Read Stock Market Trend - you'll find how to apply several good indicators on a chart of your favorite index and two other places to look for indications of stock market trend to increase your profitable trades.
Are you ready to begin? Let's go to
How to Read Stock Market Trend.
HERE'S SOMETHING NEW to Stock Trading Warrior! The Stock Trading Warrior Stock Market Direction Signal. This is a new webpage devoted to signaling market direction. As you develop your ability to read market trend, check your read of the market along with the Stock Trading Warrior's market signals. Go to
The Stock Trading Warrior's Stock Market Direction Signal.
Also, read about on what you can do when the markets aren't trending or become volatile like in 2011 over at
What Happens When the Market Isn't Trending?
Next month, we'll cover Step. 4 in creating a Stock Trading System - How Much to Invest - Position Sizing to reduce your overall risk and help to to sleep well at night while increasing your wealth.
The Amazing Origins
of the Stock Market
Looking back at the origins of the stock market, the history behind it is amazing. There are some scholars who believe share trading was going on as early in history as Ancient Rome. And interestingly, if you asked a somewhat knowledgeable investor how the stock markets evolved in the U.S., most of them would probably guess it was the famous story of traders meeting under a buttonwood tree in N.Y. - the origins of the NYSE - when really the first "stock market" originated in another historical U.S. city. To find out which one, and if you're a history buff and an investor, you might like the new webpage:
The Amazing Origins of the Stock Market.
STW Comedy Corner
A minister dies and is waiting in line at the Pearly Gates. Ahead of him is a guy who's dressed in sunglasses, a loud shirt, leather jacket, and jeans.
Saint Peter addresses this guy, "Who are you, so that I may know whether or not to admit you to the Kingdom of Heaven?"
The guy replies, "I'm Joe Cohen, stockbroker, of Noo Yawk City."
Saint Peter consults his list. He smiles and says to the stockbroker, "Take this silken robe and golden staff and enter the Kingdom of Heaven."
The stockbroker goes into Heaven with his robe and staff, and it's the minister's turn. He stands erect and booms out, "I am Joseph Snow, pastor of Saint Mary's for the last forty-three years."
Saint Peter consults his list. He says to the minister, "Take this cotton robe and wooden staff and enter the Kingdom of Heaven."
"Just a minute," says the minister. "That man was a stockbroker-- he gets a silken robe and golden staff but I, a minister, only get a cotton robe and wooden staff? How can this be?"
"Up here, we work by results," says Saint Peter. "While you preached, people slept; his clients, they prayed."
Stop Limit Order Question

Dear Stock Trading Warrior-
If I am trading through a self-trading platform and I place a buy order for a stock. Lets say 200 shares. The purchase comes back higher than the limit price I set. Part of the purchase is 20 per share and the other is 21 per share. However, the high for the stock on that day is only 20.30. How can this be? Shouldn't the high be 21 if as they say part of the purchase--100 shares--was bought at 21. The company I bought has a historical price tracker on their site and they have the high for the day at 20.3. In fact it is the high for the week. How is this possible? Thanks for helping.
Jack
Chicago, IL
Dear Jack-
Thanks for your question about the stock limit order.
First, as you know and per the SEC here's the stock limit order definition:
"A limit order is an order to buy or sell a stock at a specific price or better. A buy limit order can only be executed at the limit price or lower, and a sell limit order can only be executed at the limit price or higher. A limit order is not guaranteed to execute. A limit order can only be filled if the stock’s market price reaches the limit price. While limit orders do not guarantee execution, they help ensure that an investor does not pay more than a pre-determined price for a stock." (http://www.sec.gov/answers/limit.htm)
I can't quite understand why a partial fill was for more than your stock limit order. Even if the order couldn't be filled at once or even on that day, it should have been filled at $20 or less.
This sounds like an error on the trading platform. If you set a stock limit order at $20 then that's the limit you're willing to pay and that's the most you should have paid. The only thing I can think of is there's some kind of trade setting or default setting on this trading platform that would let a partial order go through at $20 and a partial at $21, which may have been an "ask" price. But still, I would think it should have then been a high for the day as you mentioned.
For example, there are different kinds of settings on stock limit orders like Fill or Kill (FOK) and All or None (AON). Look around where you place trades in the software to see if there's anything that could have let this happen.
This definitely warrants a call to the trading platform's customer service and a complete explanation so that this doesn't happen again. Anytime an order goes through that isn't what you wanted, it warrants a call for an explanation. I have called my broker in the past when I was unsatisfied with an order fill. If you don't mind, please let me know the explanation when you find out as it might help another person in the future.
Best-
Principal Warrior
Stock Trading Warrior Pix
Hot or Not?
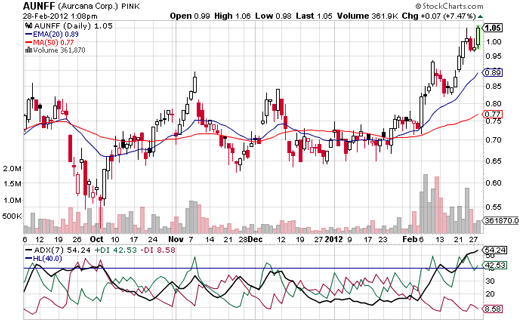
March's
ADX Double DI pick,
Aurcana Corp. (AUNFF) was spotted setting up just a few days ago. This stock is HOT. The buy price is $1.09 and it's nearing a 52-week high for the price. It also has had some recent higher than average volume. It's looking like a classic breakout with an initial stop loss of 98 cents. We'll check back next month and see if it had enough momentum to keep it moving upward.
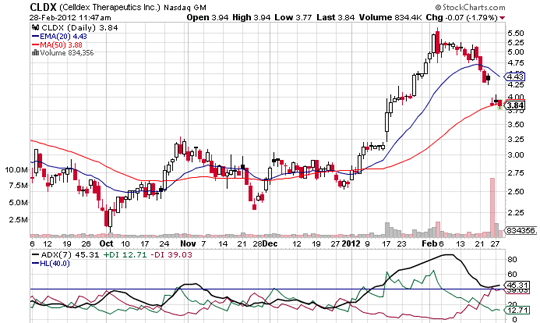
Last month's HOT pick was Celldex Therapeutics, Inc. (CLDX). CLDX set up in the ADX Double DI Strategy pattern with a buy price of $4.08 which was triggered on January 20th. It rose 38.7% from the buy point before breaking down. When the price was up more than 20%, the stop loss order was moved up to $5.00 to capture part of the gain and still give the price room to move. This worked well to capture a 27% gain when the stock sold on February 3rd.
I want to point out too, that if you follow Japanese Candlestick price formations (Candlesticks are really easy to read price bars), on February 3rd, the day the stock sold out, a bearish engulfing candlestick was formed. An engulfing candlestick is when there's a down price day that "engulfs" the previous up day. You can see on the chart above how the body of the large down day engulfed the prior day's price. This is a pretty reliable bearish signal. Since CLDX sold out, the stock has continued to lose ground and is now under $4 a share.
Part of the psychology for this trade is to remember that what we are here to do is capture gains on our investments. It's a tightrope investors and traders have to walk by knowing when to take satisfying gains and when to practice the art of letting stocks run. One of these choices is the clear winner (the GAINS!).
We can also remind ourselves that any position can be taken for a second time if the price movement warrants it - especially if an investor uses a discount online stock brokerage like Trade King (Switch to TradeKing and get up to $150 in transfer fees reimbursed. ) or Zecco (Click here to open a Zecco Trading account ) or Zecco (Click here to open a Zecco Trading account ) where the commission charges are usually less than $5 per trade. These brokers have made strong improvements to their trading platforms and the commission price is right. ) where the commission charges are usually less than $5 per trade. These brokers have made strong improvements to their trading platforms and the commission price is right.
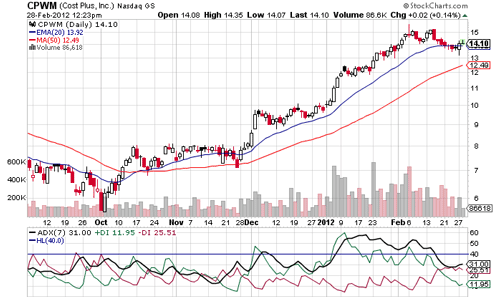
Cost Plus, Inc. (CPWM) was HOT. CPWM was beginning a strong trend upward with heavy volume and had broken above it's 52-week high in January.
The entry buy price was hit at $12.00 and earned a 16.3% gain at the beginning of February. Using the sell rules outlined in the
ADX Double DI Strategy book
a stop loss was placed at $14.25 which sold out the stock the next day for a 17.84% gain.
The stock price has been consolidating since then and could be a buy again in the future if price breaks above the high with the ADX is setting up properly.
One other thing I'd like to mention here is that time is also vital. Meaning, hanging around holding a stock position that isn't doing anything for you is not a good investment. It's prudent to be in and out of a stock when it is part of a clear and good investing plan and has earned you a gain. We'll watch it over the next month and see how it does.
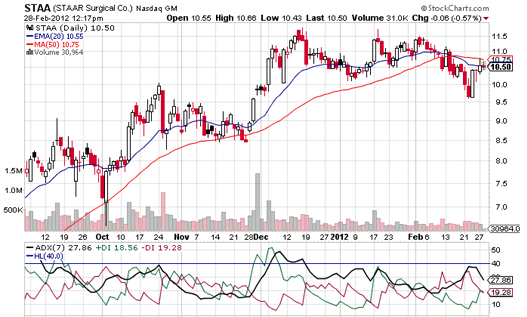
Update: December's stock watch of STAA is NOT HOT. STAA's buy price was hit at $11.11 on 12/06/11. The price went from being down -7% at the end of December to up 2.3% at the beginning of February to just being the laggard it was thought to be and it sold out at about even about a week later.
As mentioned previously, you'll find that some stocks are laggards and it's better to reinvest the money in a different stock to keep your money working for you. Unless of course, you are receiving an above average dividend payout and the price isn't losing too much ground.
The ADX Double DI Strategy looks for stocks like the ones discussed above that are setting up for strong momentum plays to hold for a week or two - up to several months. The ADX Double DI Strategy is described in detail, along with other trading plan strategies in the book:
The Stock Trading Warrior's Guide to Finding the Biggest and Best Stock Market Gainers Using the ADX Double DI Strategy.
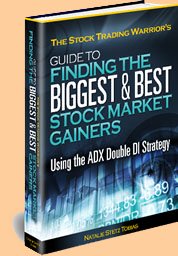
Comes with a full money-back guarantee if you're not completely satisfied.
Click here for more information about the ADX Double DI Strategy ebook.
Don't forget to look for next month's newsletter for more current stock market news, analysis and Step 4 of
How to Create Stock Trading Systems.
If you have any stock trading questions at all, please submit them on the
Stock Trading Warrior contact page.
Thank you for reading What's New at Stock Trading Warrior!
For additional stock trading information and tips, please visit
Stock-Trading-Warrior.com
If you enjoy this ezine, please feel free to forward it to your friends. If it was forwarded to you and you'd like to subscribe, please do so by visiting
Stock Trading Warrior Home
and sign up using the opt in box.
|


