Advance-Decline Issues for NYSE and NASDAQ ($NYAD and $NAAD)
SPONSOR: The trend is your friend! Click here to see the Top 50 Trending Stocks.
Advance-decline issues are another way to confirm a tend or to look for an indication of whether stock market trends may be changing direction. Advance-decline issues are simply an index of how many stocks are advancing versus declining in any given period. Whichever is the larger group "wins" the time period whether you're looking at a daily chart or an intra-day chart.
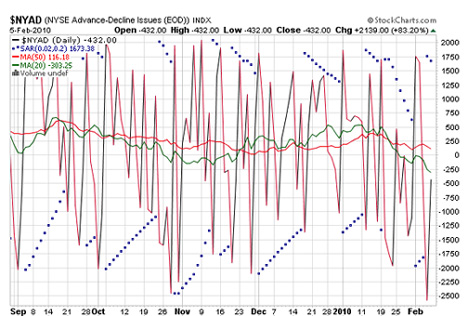
The advance decline issues index can give you a reading of whether there is a stock market trend occurring by seeing if there are more stocks that have advanced or declined for the day and subsequently, if investor sentiments are bullish or bearish. You can look at either the NYSE or NASDAQ advance decline issues and the symbols for them are $NYAD and $NAAD. When the chart comes up it may be hard to read because of it’s volatility as in the example below:
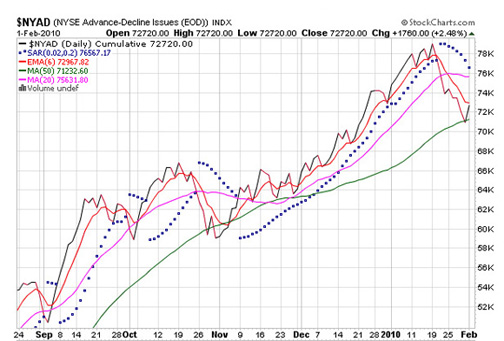
You'll need a way to make sense of this chart. To so so and get a much more comprehensive version, look under the chart attributes in whatever chart program you use and look for “Type (of chart),” select “Cumulative” and that will smooth out the line as in the example below:
These are the same data charts, but what a difference!
Also, notice the 6-day EMA (green line) crossover as an earlier indicator that market direction may be shifting.
As you can see, I leave on the
parabolic SAR indicator
overlay, and I also have on the 6-day
exponential moving average
and the 20-day and 50-day
simple moving average.
The area of
advance-decline issues is one of several really good ways to determine stock market trend.
Go from how to read advance decline issues to options trading equity put/call index.
Return to Online Stock Trading Warrior Home.
|