|
Stock Market ChartsSPONSOR:  Even if you study fundamentals, a purchase should never be made without some knowledge of chart reading and perception of how to read the
trend of the stock price
and
market direction. If you aren’t yet comfortable reading an online stock chart, checkout “Reading Stock Charts Made Easy.” There you’ll see how most stock trading charts are set up, what information a chart provides and what you want to look for on a chart. There are many sources for stock charts including your online stock brokerage, but make sure you find a chart service that you find easy to read, provides helpful overlays and is easy to adjust and view with any indicators you like to use. The ability for historical charts to give you important information is also found in the stock market history graph of the Dow Jones Industrial Average beginning in 1900. Lastly, just for fun, take a look at some gorgeous charts in the Stock Chart Hall of Fame under
Best Stock Trading Charts of 2010
or
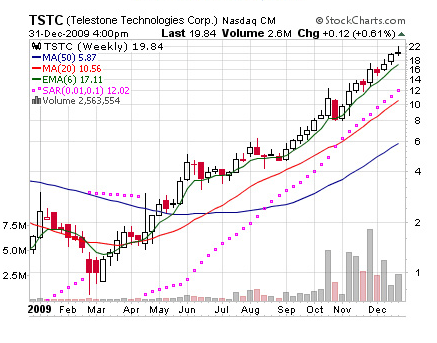
Best Historial Stock Charts of 2009.
Here you’ll find some of the best performing stocks by percentage increase. |
Search Stock Trading Warrior
Free Videos
Presented by 30year Market Veteran Adam Hewison
Stock Market Insights
How a Simple Line Can Improve Your Trading Success
"How to draw a trendline" is one of the first things people learn when they study technical analysis. Typically, they quickly move on to more advanced topics and too often discard this simplest of all technical tools. Read more...
Is a Stock You Own in
a Trend?... Find Out Now!


