Stock Chart Hall of Fame Best Stock Trading Charts of 2010
SPONSOR: The trend is your friend! Click here to see the Top 50 Trending Stocks.
Examining the best stock trading charts each year can help you improve your trading and if you traded any of them - congratulations! In general, 2010 was a good year in the stock market with a bump in May, but if you had a way to read the
stock market trend
it would have prevented any gigantic losses in your portfolio.
The charts here are presented in a weekly chart format and gain figures are from January 1 to December 31, 2010. Capturing a portion of any of these gainers would have greatly enhanced your year. But even if you didn’t invest in any of them, I encourage you to review them in your daily chart program and measure them against your own stock trading strategies to determine if you missed anything that would have made you more successful in 2010.
See what you notice about these stock market charts. Are there any general patterns you can pick up? What did the indicators you use look like at the start of a rise? Are there any candlestick patterns that show up? What was volume doing? Whichever criteria you use for picking stocks, look at these big winners to see if your criteria would have found one or more of these gems during their big rise.
Gains are approximate. Enjoy the best stock trading charts of 2010!
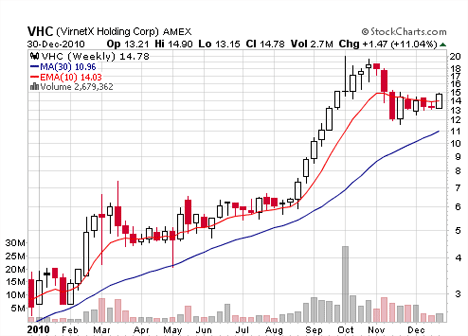
VHC - Gain of over 400%!
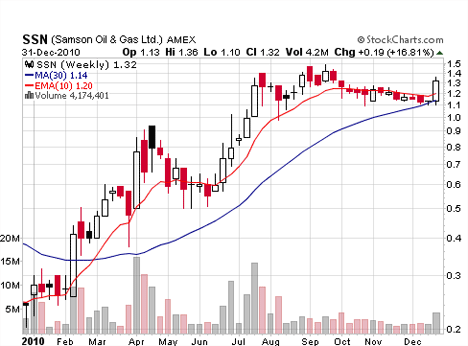
SSN - Gain of over 420%!
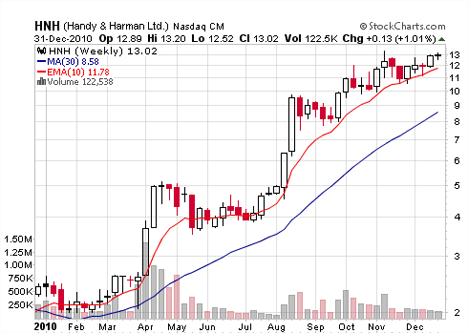
HNH (formerly SYMB: WXCO) Gain of over 440%!
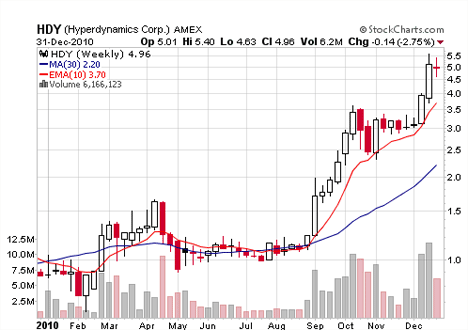
HDY - Gain of over 470%!
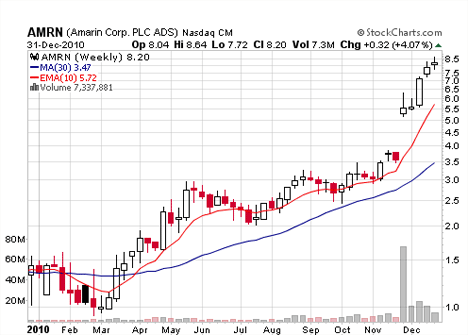
AMRN - Gain of over 480%!
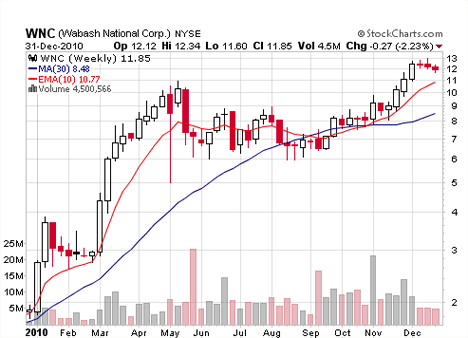
WNC - Gain of over 520%!
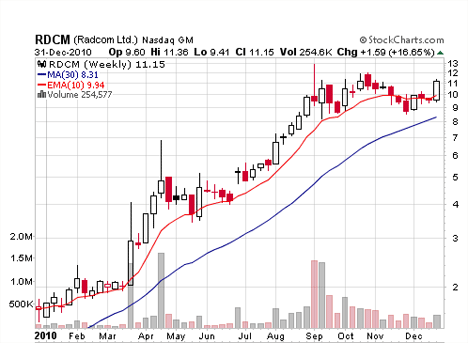
RDCM - Gain of over 560%!
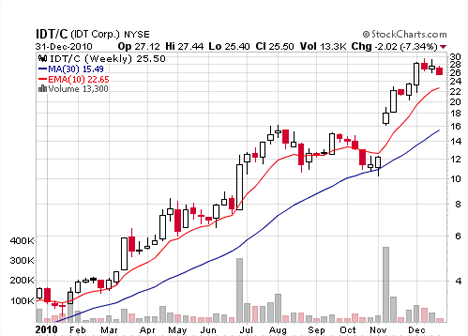
IDT/C - Gain of over 590%!
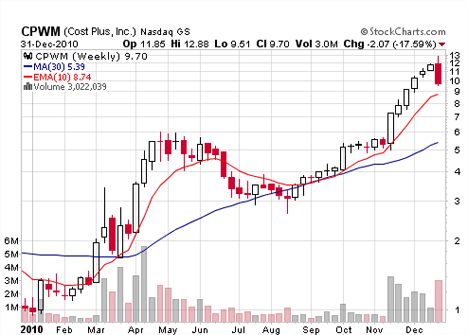
CPWM - Gain of over 930%!
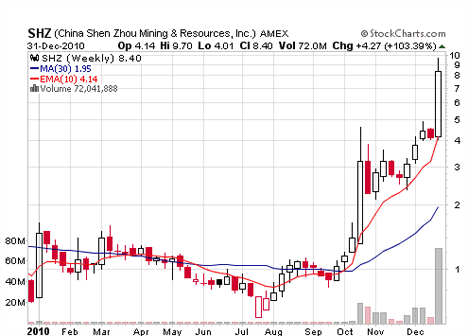
SHZ - Gain of over 1,170%!
Back from 2010 Chart Hall of Fame to Stock Market Charts.
Back from 2010 Best Stock Trading Charts to Learn Online Stock Trading.
|