|
Stock Chart Hall of Fame
|
Search Stock Trading Warrior
Learn about Options
Options are a solid weapon to have in your investing arsenal to hedge positions or manage risk. Learn from the 2019 U.S. Investing Champion, Trader Travis.
Stock Market Insights
Want a peek at DOW Jones Industrial Stocks that are beginning to trend?
Click HERE!
Learn Trend Trading!
Free Videos
Presented by 30year Market Veteran Adam Hewison
What really makes a stock price rise? To find out watch:
Stock Market Insights
How a Simple Line Can Improve Your Trading Success
"How to draw a trendline" is one of the first things people learn when they study technical analysis. Typically, they quickly move on to more advanced topics and too often discard this simplest of all technical tools. Read more...
a Trend?... Find Out Now!
Online Stock Brokers
Read the online brokerage discussion...


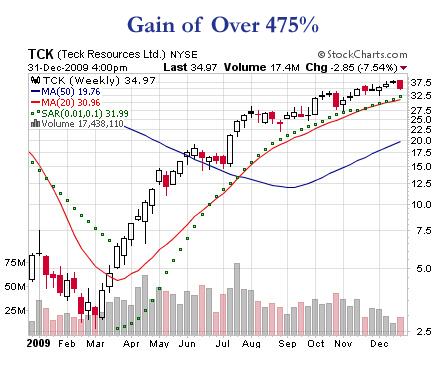
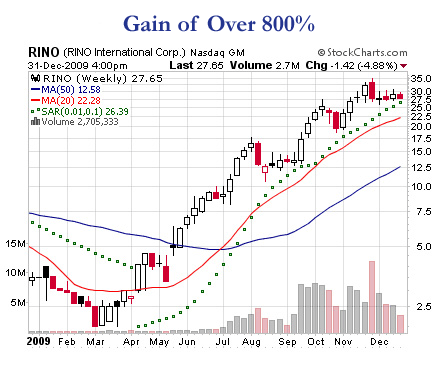
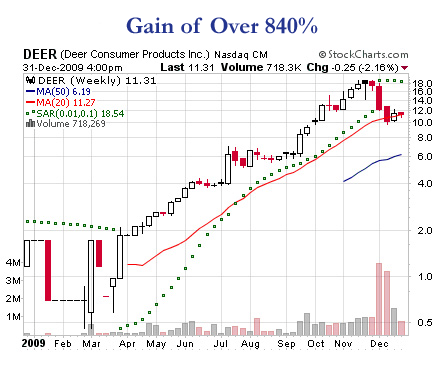
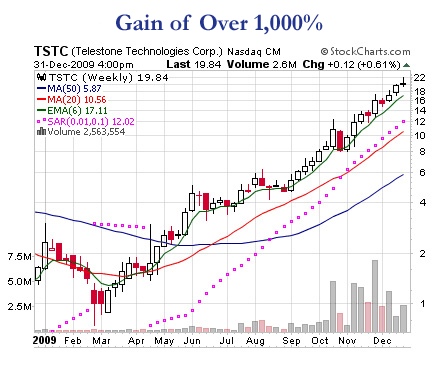
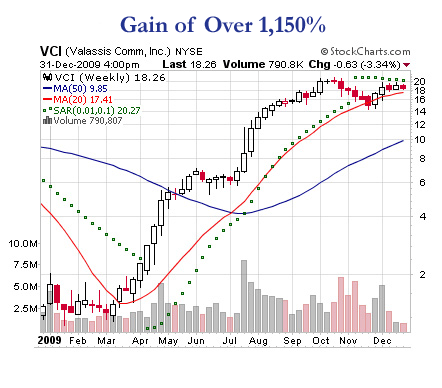
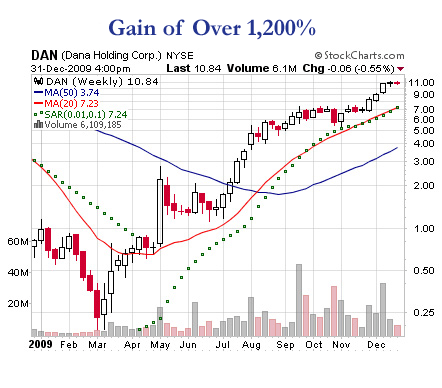
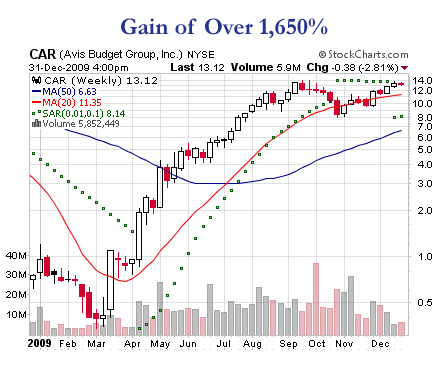
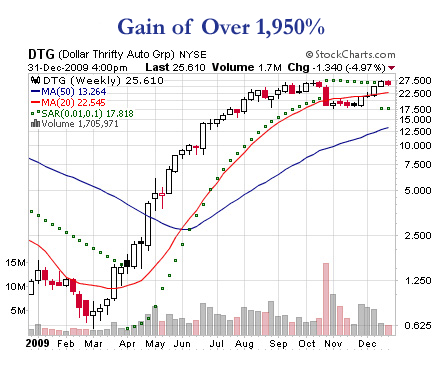
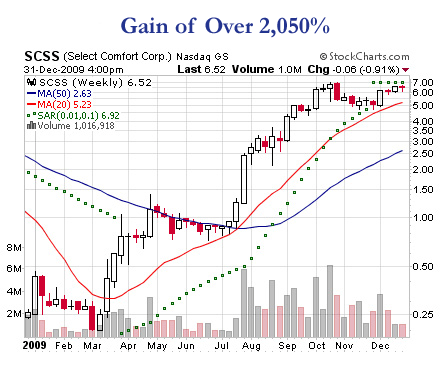
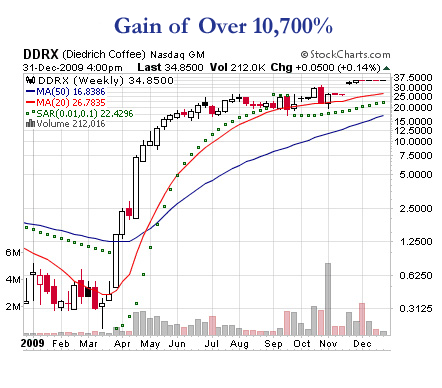
 Capturing a portion of each of these gainers would have greatly enhanced your year. But even if you didn’t, I would encourage you to review them.