Position Sizing
Take Charge of Your Portfolio
SPONSOR:
The trend is your friend! Click here to see the Top 50 Trending Stocks.

This webpage describes the basics of position sizing and the series also includes:
Risk Management PS Primer - Understanding Your Risk
PS Using a Stock's Average True Range
Stock market position sizing goes hand-in-hand with minimizing downside risk. It’s the act of choosing how much of your money you’ll put in any one position and thereby avoiding the possibility of exposing yourself to too much risk by putting too much money in one stock. If you do put too much money in one stock it’s called "over weighted." If you're over weighted, and the stock price goes down dramatically, the result will be that it takes with it much of your capital.
 So, how much money do you put in one position? It seems like an easy question, but really, it’s not and here’s why: All seasoned investor’s know how much they’re willing to lose before they even get into a position and believe it or not, this has a lot to do with the size of a stock position. It’s because there’s a relationship between not losing too much, but also letting the stock price move around after you buy it. Two items to be aware of before you decide your position size:
2. How losses affect your portfolio.
First, identify your risk profile by going to
Risk Management Position Sizing Primer.
After that, some valuable knowledge about the second item is below.
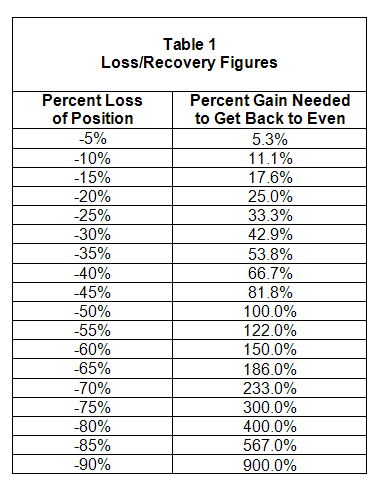
Investors should be aware that the percent gain it takes to recover a loss increases geometrically. It’s easy to think that if you’re down 20% in a position, that the price has to increase by the same 20% to get back to even. But this isn’t the case. For example, if you have 100% of your money in one position and it goes down 50%, the price of that stock has to go up 100% to get you back to just even! This is bad. Take a look at Table 1 below of the loss/recovery figures to really get a sense of what happens when losses get out of control:

Looking at the table above, you can see how important it is to minimize your exposure to risk loss. In fact, I hope it made you nervous because you can see that you really don’t want a loss to be more than -25% at the most. Knowing this will make you a better stock investor. It’s one thing to be aware enough to control losses and know
when to sell a stock,
but you can start minimizing risk before you even open a stock position by sizing it correctly. Diversifying and spreading the risk between multiple stock positions and knowing how much to put in any one position is the first buffer against the risk of loss.
You could use a fixed size strategy, where you would simply decide to put the same amount of money in each position. If you had a $10,000 portfolio and you just chose to put $2,000 worth of stock in each company you’d have a maximum of five positions.
You can use this strategy, but one problem with the same monetary size is that not all stocks are created equal. They’re at many different price points and they all move and fluctuate differently than each other. If you bought a stock that fluctuates dramatically you’d be exposing $2,000 or 20% of your portfolio to greater risk. What if you had five stocks that were volatile and they all went down dramatically?
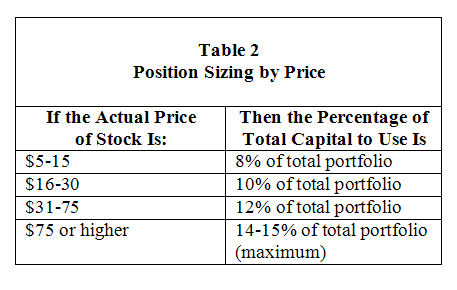
You could also position size according to the price of a stock. In general, lower priced stocks tend to fluctuate more broadly than higher priced stocks. Based on that idea, you can generalize and minimize risk taking a smaller sized position in lower-priced stocks. Table 2 below offers an enhanced version of straight fixed position sizing:

Note that this table also offers up the suggestion that you should have a maximum position amount for any stock. In this example, the maximum for any position size should be 15% otherwise you may be overexposed in one company. Using the $10,000 portfolio size, the biggest position would be $1,500.
But, if you’re willing to use a slightly more advanced method to maximize your position sizing technique, this brings us to the concept of position sizing using the average true range of a stock. The average true range of a stock is the amount the price of a stock moves each day averaged out over a period of time. Average true range or ATR give you a sense of the price “personality” of the stock and can help you better estimate the risk involved with individual stocks. If you’re interested in learning more about the ATR and the size of a position visit,
Stock Market PS
which covers how to tailor your sizing in more detail using each stock’s unique price movement.
You’ll need three pieces of information to calculate the position amount using the ATR:
For how to position size using the ATR,
click here.
Return to
Stock Market Systems.
Return to
Online Stock Trading Warrior Home.


 So, how much money do you put in one position? It seems like an easy question, but really, it’s not and here’s why: All seasoned investor’s know how much they’re willing to lose before they even get into a position and believe it or not, this has a lot to do with the size of a stock position. It’s because there’s a relationship between not losing too much, but also letting the stock price move around after you buy it. Two items to be aware of before you decide your position size:


