Stock Market Performance Lists
SPONSOR:
The trend is your friend! Click here to see the Top 50 Trending Stocks.

These stock market performance lists are lists of stocks that are performing or have performed well. These lists serve two purposes. - Looking at top stock market performance lists can give you an idea of what you're looking for in selecting a new stock candidate when you study the best of the best. The best stock performers are used as a model for future stock buying candidates.
- Stocks that are performing well can sometimes continue to perform well and are worth following even if it seems as though the price has matured to an unsustainable level. Sometimes these very stocks take a break in price movement and then continue on with refreshed price movement.
These lists are starting points based on your trading philosophy. Remember that when you learn how to use
technical analysis stock trading
as part of your investing strategy, you don't need to blindly listen to anyone else. You will have a tool that you can use to determine whether the investment looks promising or is flat lining.
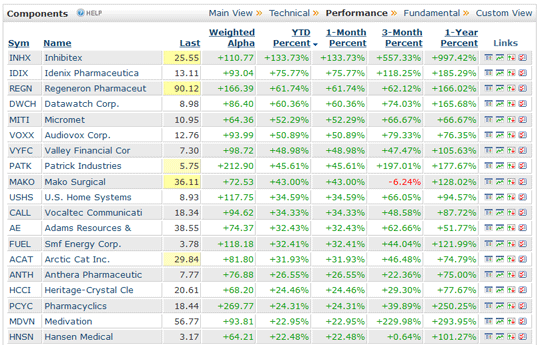
Barchart.com - This list provides some of the most impressive top stock performers by YTD, 1-Month, 3-Month and 1-Year (sample below).

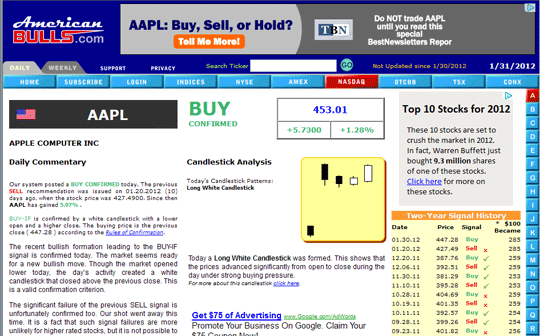
AmericanBulls.com - An awesome website for actively learning Japanese Candlestick price pattern analysis. They offer a short list of stocks to watch and if you click on one of them to view the recommendation, you'll also see the alphabet in blue in the farthest right-hand side of the opened page. Click on any letter to see large groups of stocks with recommendations.

ACTION STEP: Take a look at one of the websites listed above like Barcharts.com Top 100 or NASD100.com. Take the technical indicator you've chosen to use to assess how price is doing and look at the
stock market charts
of each stock. How does each top performer's indicator look? If you're using
moving average
as your technical indicator, are the lines all trending upward? Has there been a recent moving average line cross? What about volume? Is there an increased level of volume? If you're using the
Average Directional Index
(ADX) is the indicator signaling an enthusiastic upward trend? Is the trend early or mature?
There are lots of websites that offer stock performance or recommendations. If you're using a website that frequently recommends stock picks, be sure to read about how the various websites came to their list of top picks as methodologies vary.
Return to
How to Find the Best Stocks to Buy.
Return from
Stock Market Performance Lists to Online Stock Trading Warrior Home.
 
|


