Trend Following
Stock Trading System
A trend following stock trading system is a terrific way to do well in the markets. Once a stock gets into a trend and you know what to look for, a good trend can go on for a while allowing you to capture a gain on your investment. This webpage is part of a series on learning online trend trading.
A stock trend can be either up or down, but a trend is a price direction that has established itself. Once a stock price has established a trend, it’s logical to trade along with that trend. The price trend is reflecting to you the general trader’s sentiment about the stock. This is valuable information to understand!
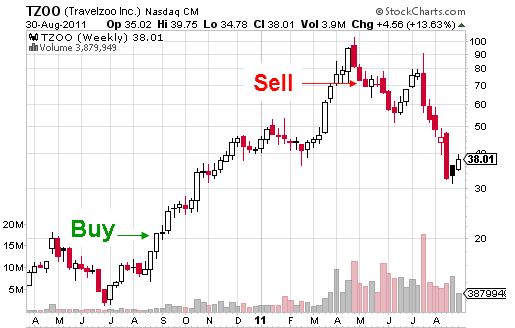
The goal of trend trading is to take a gain on a portion of the trend. It’s truly difficult and pretty unlikely to capture a gain from the very price bottom and sell at the very top. The next best thing is to capture a portion of the move as you can see in the example of Travelzoo Inc. (TZOO) below.

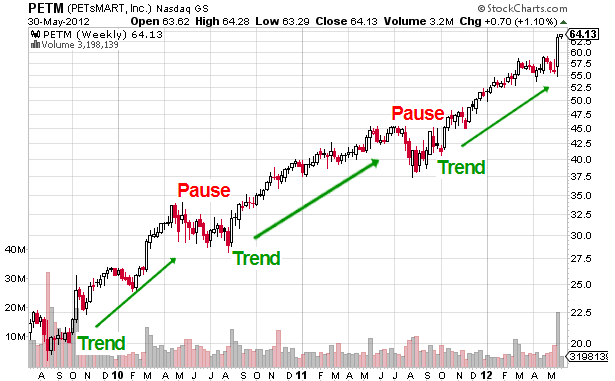
Many trends typically move in stages or “legs.” The general price pattern of a trending stock is trend-pullback-trend. This pattern happens when price is moving upward or downward. The interest is picking up steam, pauses, then resumes. Take a look at this pattern in an uptrend in the example of PETsMART, Inc. (PETM) below.

The number of legs can vary, but as you learn to see the trends, you’ll want to get in sooner, rather than later. Ultimately, getting in on the first or second leg of a new long-term trend is where big gains are made in stock trading.
This multiple leg pattern can be seen over and over again. A long-term trend is not always guaranteed, but with what you’ll learn here, you’ll put the probability of success in your favor.
The key to a trend following stock trading system is the ability to identify a newer trend. The way to do this is to look for a stock price that's at a new 52-week high that has previously traded in a range for a while or one that has completed one or two legs, pulled back and now is resuming the trend.
If you see that a stock price has trended over a long period of time, it’s not as good a candidate for purchase as one that has more recently begun to trend. On a long-side trade, the reason is that people’s interest and also fear levels grow after a price has risen dramatically and traders may want to take gains. When that happens, it can create an avalanche of selling that causes the price to fall and if you bought in late, it’s likely you will end up with a loss.
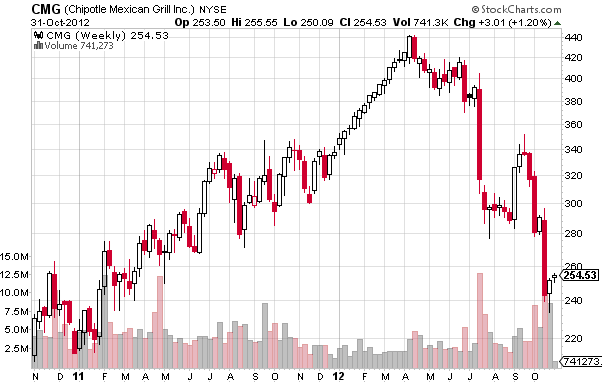
This is what happened with Chipotle Mexican Grill, Inc. (CMG). After over a 700% increase in CMG’s price in three
years the price finally broke down as investors exit to capture a gain. CMG's price is now in a downtrend as you can see in the chart below.

Also know that there are trends within trends – meaning you’ll be able to follow smaller trends within larger trends. Some of this depends on the time period of the chart you're using. There are monthly, weekly, daily and intraday charts.
In general, trend following stock trading systems fall into the following ranges:
- Long-term: 6 or more months
- Intermediate: 1-6 months
- Short-term: Less than a month
- Day trends: Within the time period of a day.
The first thing to decide is the length of trend period you want to invest in - whether you want to invest in long-term, intermediate, short-term or day trends. This is going to depend on how much time you choose to spend sitting in front of your computer.
ACTION STEP: Decide on the trend period you'll be comfortable trend following in your stock trading system.
Congratulations, you know have a basis for understanding how price trends move. Ready to move on to applying moving averages which will bring to light the price trends/legs you're looking for and help your trend following stock trading system? Then head over to:
Return from Trend Following Stock Trading System to Beginning Trend Trading.
Search Stock Trading Warrior
Free Videos
Watch Todays 1pm Market Update
Presented by 30year Market Veteran Adam Hewison
What really makes a stock price rise? To find out watch:
What Makes a Stock Go Up?
Stock Market Insights
Is a Stock You Own in
a Trend? Find Out Now!

Online Stock Brokers
Free Videos
Presented by 30year Market Veteran Adam Hewison